How To Communicate Metrics To ELT And Boards As A Marketing Leader
Metrics and impact communication stumps everyone at every level. You are never really taught how to communicate, and it’s a critical skill you have to work on and never stop improving.
Once you hit the top tier of the C-Suite you should be conditioned in translating your department metrics into business metrics, this often is the difference between great and good C-Suite leaders, Marketing leads can struggle (more than most) to get out of the engagement metrics, volumes of activity & the why, which misses the mark and doesn’t communicate the business impact.
Request a PDF version of this metrics guide by emailing me danny@dannydenhard.com
The Known Issues
I have spoken to a number of founders, CEO, CMOs, CGOs in recent months and other than the explosion of channels and uncertainty, the main theme is the disconnect in communicating Marketing success and the impact it is having on the business.
Earlier this week, I received an anonymous question from a Marketing leader who is struggling to make their leadership team understand the impact that their team is having and removing the famous corporate leadership glaze over when you are discussing Marketing activities and connecting to Marketing and then business results.
In the rule of 3, I break down metrics into 3 core categories:
Level 1: Business Metrics
Level 2: Department Metrics
Level 3: Team Metrics
Let’s dive into the levels and how to shape communications to those around you at Leadership team level and how to shape reporting and analysis for your team leads to help you communicate your business impact.
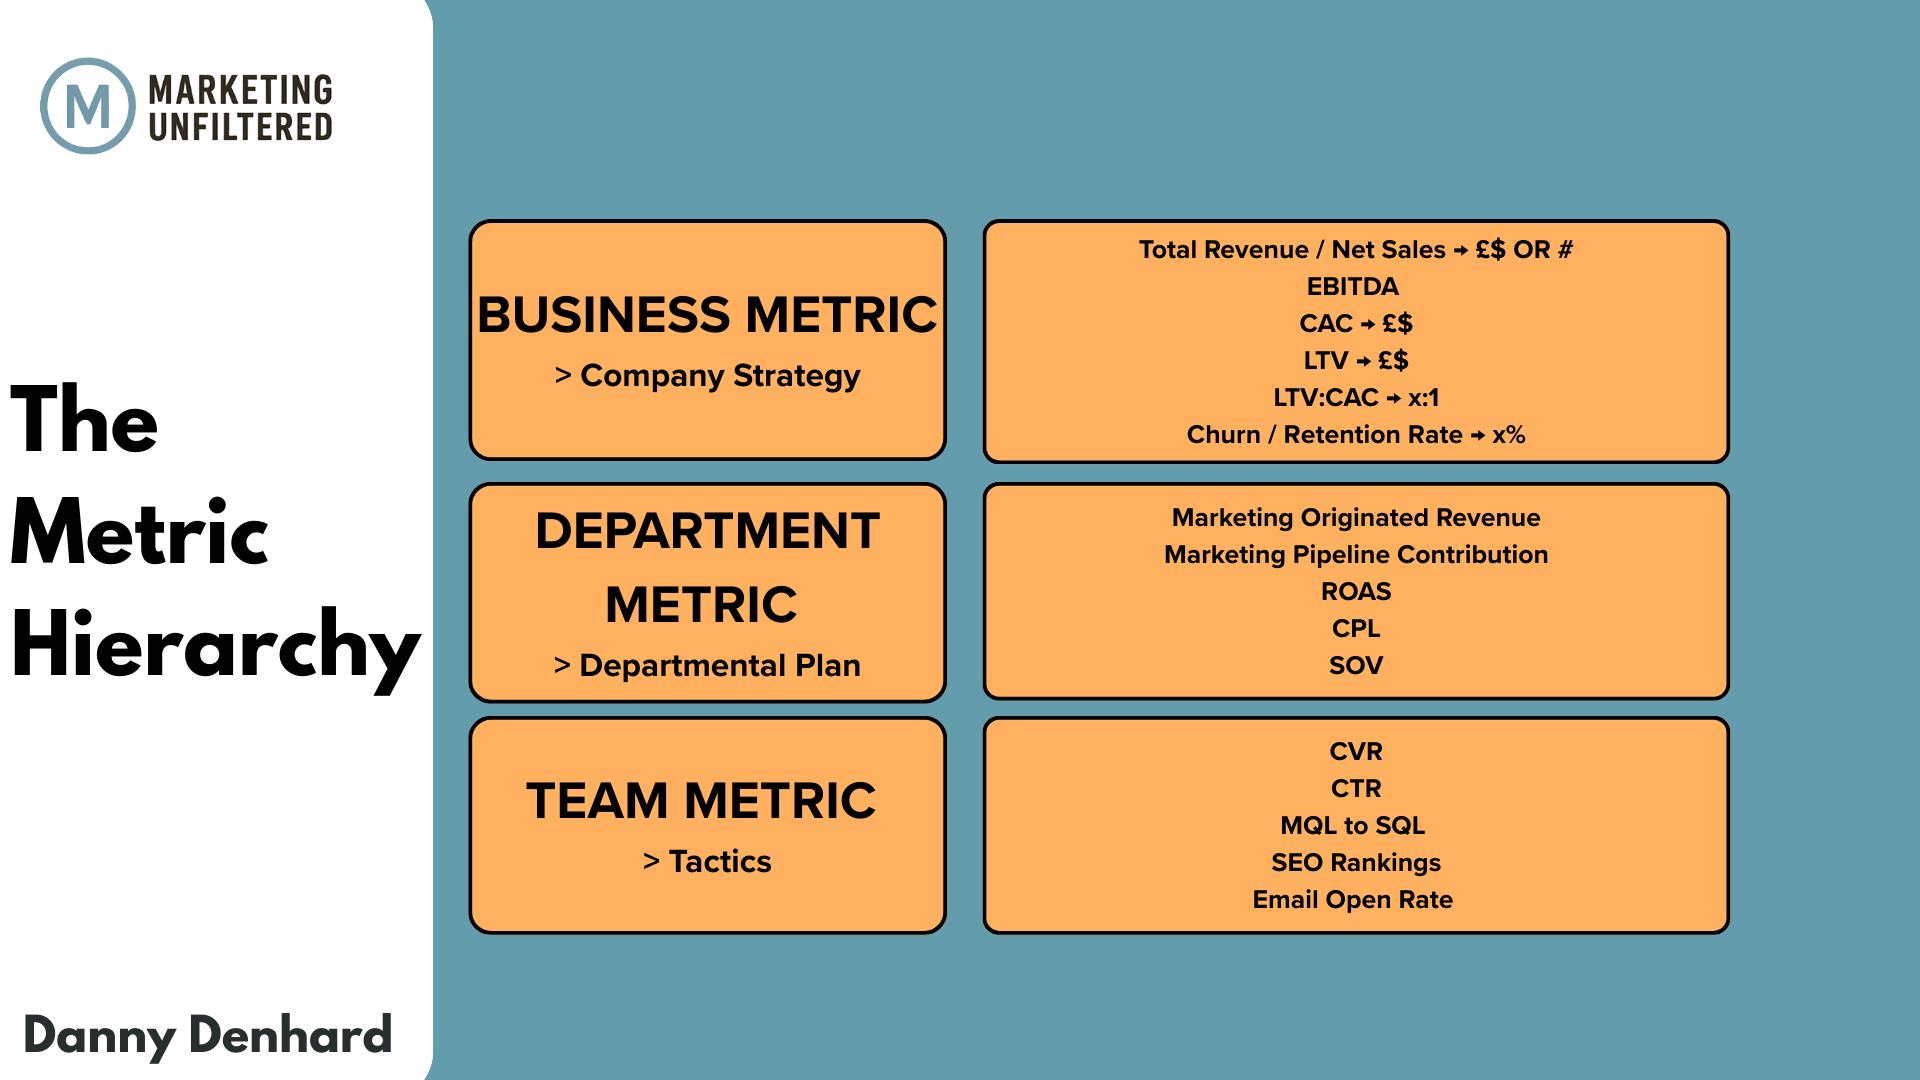
The Metrics Hierarchy: From Vanity To Strategic
→ THE “C-SUITE” ZONE
1. Business Metrics
These are the numbers the founders, CEO, COO, CFO, and Board truly care about.
If it doesn’t eventually impact these metrics, the C-suite considers it “noise” or “Marketing fluff”.
I have used as standardised examples as possible, please replace with what your business metrics.
Examples:
Total Revenue / Net Sales: The top-line growth.
EBITDA: Earnings before interest, taxes, depreciation, and amortisation. This measures operational profitability.
Customer Acquisition Cost (CAC): Total sales and Marketing spend divided by new customers acquired.
Customer Lifetime Value (LTV): The total revenue a business can expect from a single customer account.
LTV:CAC Ratio: A measure of efficiency. (A 3:1 ratio is still considered the “Gold Standard“).
Churn Rate / Retention Rate: The percentage of customers leaving vs. staying.
Add revenue figures and numbers as far down the hierarchy as possible - this way you demonstrate the teams have mapped from bottom to top
→ 🧠 THE INFORMED CMO ZONE
2. Department Metrics - The “Director/VP” Level
These metrics show how the Marketing department, as a whole, contributes to the business metrics above. These are what you work on, optimise constantly and drive efficiencies towards.
These metrics guide the Department leaders, Teams leads and teams on how successful they are and connecting into the company strategy and the most important metrics.
Examples:
Marketing Originated Revenue: Revenue that started from a Marketing touchpoint.
Marketing Pipeline Contribution: The pound/dollar value of deals in the sales funnel generated by Marketing.
Return on Ad Spend (ROAS): Revenue generated for every pound/dollar spent on advertising.
Cost Per Lead (CPL): How much it costs to get a potential customer into the system.
Marketing Share of Voice (SOV): How much of the “market conversation” your brand owns compared to competitors.
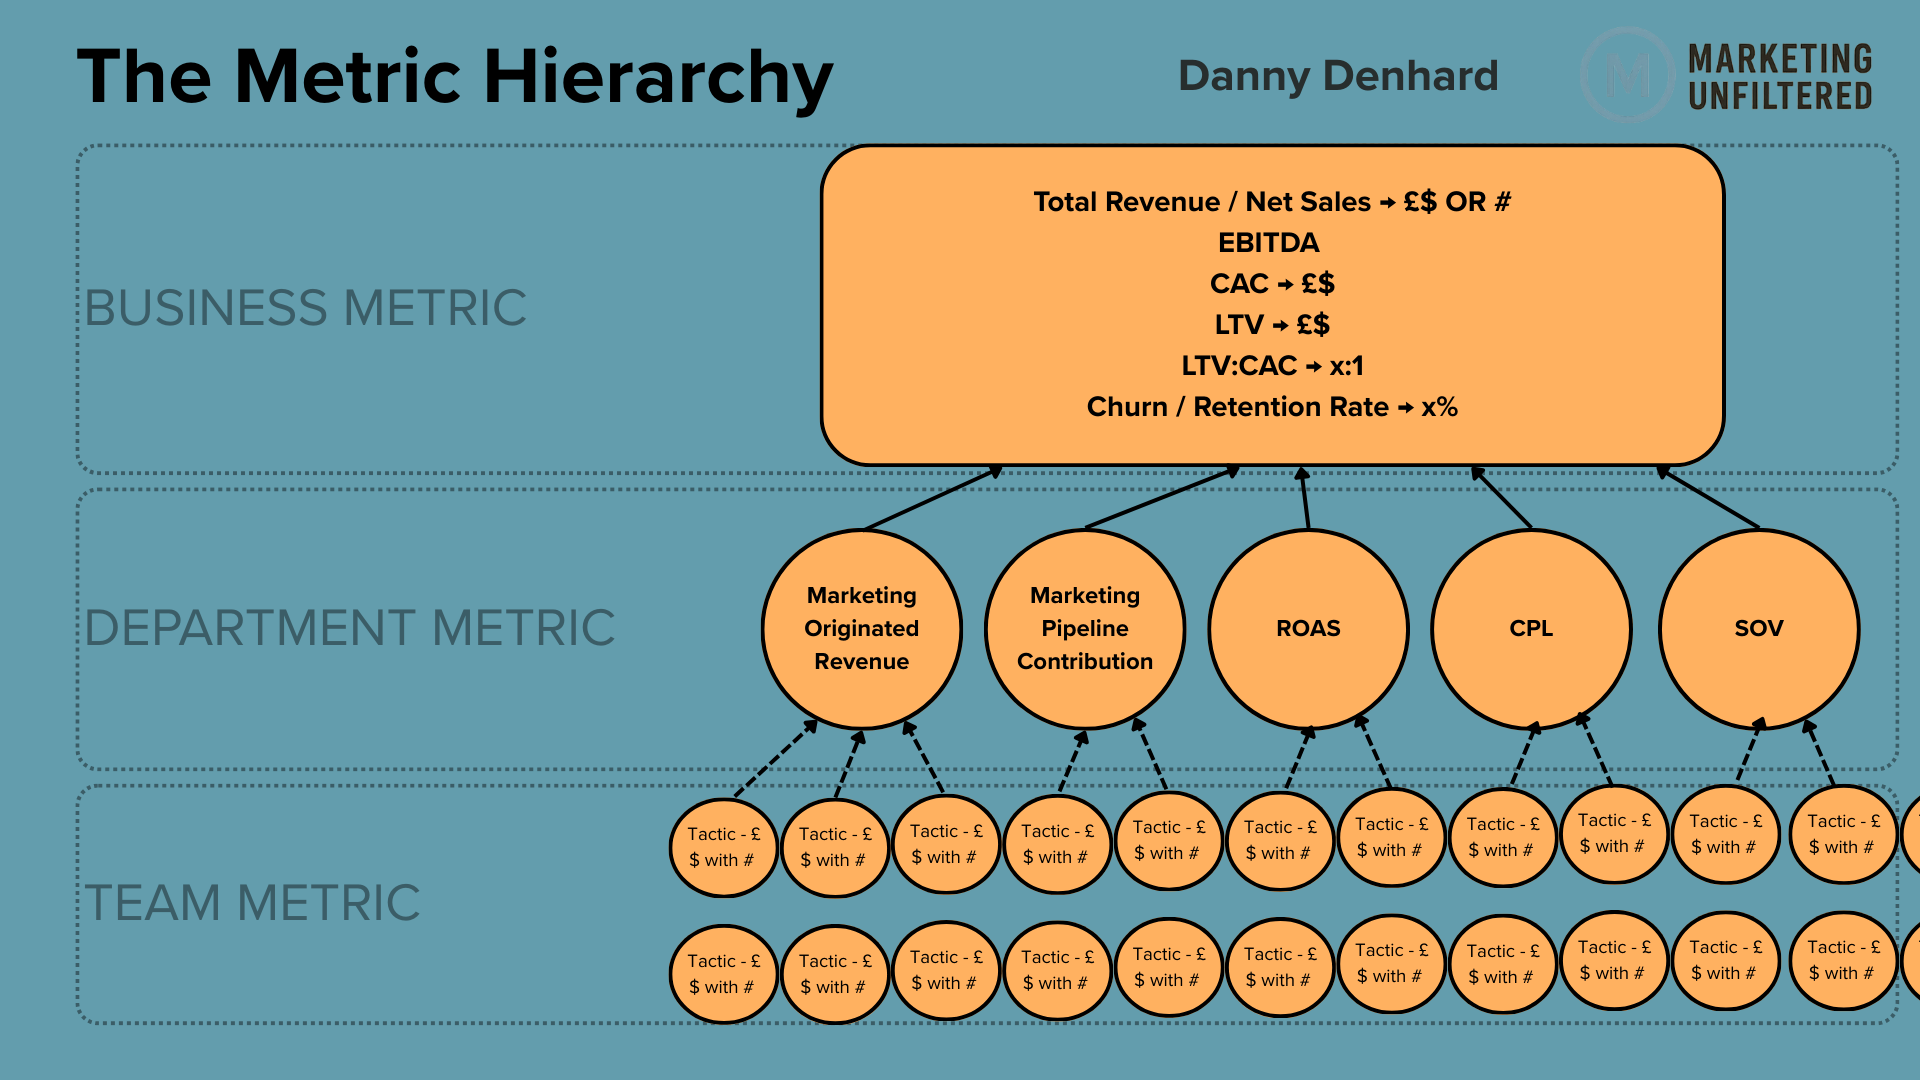
This connects team metrics and tactics into your departmental plan and associated metrics up and through to business metric, with $£ figures and numbers to land your impact
→ ⚠️ THE CORPORATE DANGER ZONE
3. Team Metrics - The “Manager/Execution” Level
These metrics are diagnostic. They help the Marketing team understand why the department metrics are up or down. These metrics help to connect to Team and Department goals and ladder up to Department Metrics, these are often seen as vanity metrics, but, without these it is hard to understand what is happening on the ground. It’s the sense check Marketers care about that others suggest is noise not signal.
These metrics give the team the feel of the market and how customers are reacting to Marketing activities.
Examples:
Conversion Rate (CVR): The % of visitors who take a desired action (e.g., signing up for a demo).
Click-Through Rate (CTR): Effectiveness of ad creative or email copy.
MQL to SQL Conversion: The speed and quality of leads moving from Marketing to Sales.
SEO Keyword Rankings: Visibility for high-intent search terms.
Social Media Engagement: Engagement metrics like views, reactions, likes and replies
Email Open/Click Rates: Engagement levels of your existing database.
FWIW your CPO has vanity metrics too, including total registered users, app downloads, feature clicks, and your Sales lead/CRO has vanity metrics like activity count, calls made, leads generated, lead count, outreach numbers etc.
Ways To Diagnose Performance Issues Through Vanity Metrics → Business Metrics 💡
Here is a key example of why vanity metrics are still important and how you can help improve your leadership teams knowledge by connecting the vanity metrics up through to known business issues through diagnosis of performance drops or revenue drops.
Diagnosis & Steps Taken:
(1) Channels & Conversion: Check revenue and traffic by channel – what’s up, down, or flat?
(2) Product & Tech: Confirm any outages, releases, or bugs that could have hit performance.
(3) Search & Algorithmic Updates: Review SEO rankings, ranking URLs, AI overviews, and recent Google updates for any major changes.
This will work both in Excel as a checklist or fit nicely on a slide/image.
Coach The Team On The Difference 📈
When Marketing leaders first join exec meetings, they often fall into “over‑explaining and over‑defending” drowning the room in tactics and vanity metrics instead of leading with business impact.
Part of your job is to coach them on this shift before they walk into the room.
Complete This Internal Department Exercise ☑️
Run this as a working session with your Heads of / Team leads:
List every metric you report today and put each one into Level 1 (Business), Level 2 (Department), or Level 3 (Team). Then map your Level 1–2 metrics directly to your OKRs or equivalent. If a key objective doesn’t have a clear metric, or your metrics are all Level 3, you have a focus problem.
This is always well-received with my coaching and consulting clients.
Hint: Understand in your specific business where K-Factor and NPS (or CSAT) sits, some boards still consider NPS as their key metric to positively push on.
Remove These Words ❌
Certain words quietly weaken Marketing leaders in exec rooms: a bit, a little, extremely, just, kind of, pretty, quite, really, slightly, so, sort of, stuff, very.
Audit your next deck and and speaker notes/script – remove them and see how much more decisive you sound.
Go ahead with confidence anonymous, map this out and treat it as a team exercise, you can choose if it’s you and your Heads of / Team leads or a whole team exercise. This should provide you confidence to drive your Department and business forward.
If you are struggling with leadership and would like to discuss coaching, book a call with me below
This is my latest newsletter for Marketing Unfiltered, where I share my hierarchy for improving your communication to the leadership team and the board. You can subscribe below to receive our weekly updates